OPENDSR

Turn work into insight

Track performance, engagement, and adoption across your organization — all from one connected platform. OPENDSR Insights brings together data from work, documents, communities, and users to provide a complete view of how your organization operates.

Insights are not reports — they are visibility across work

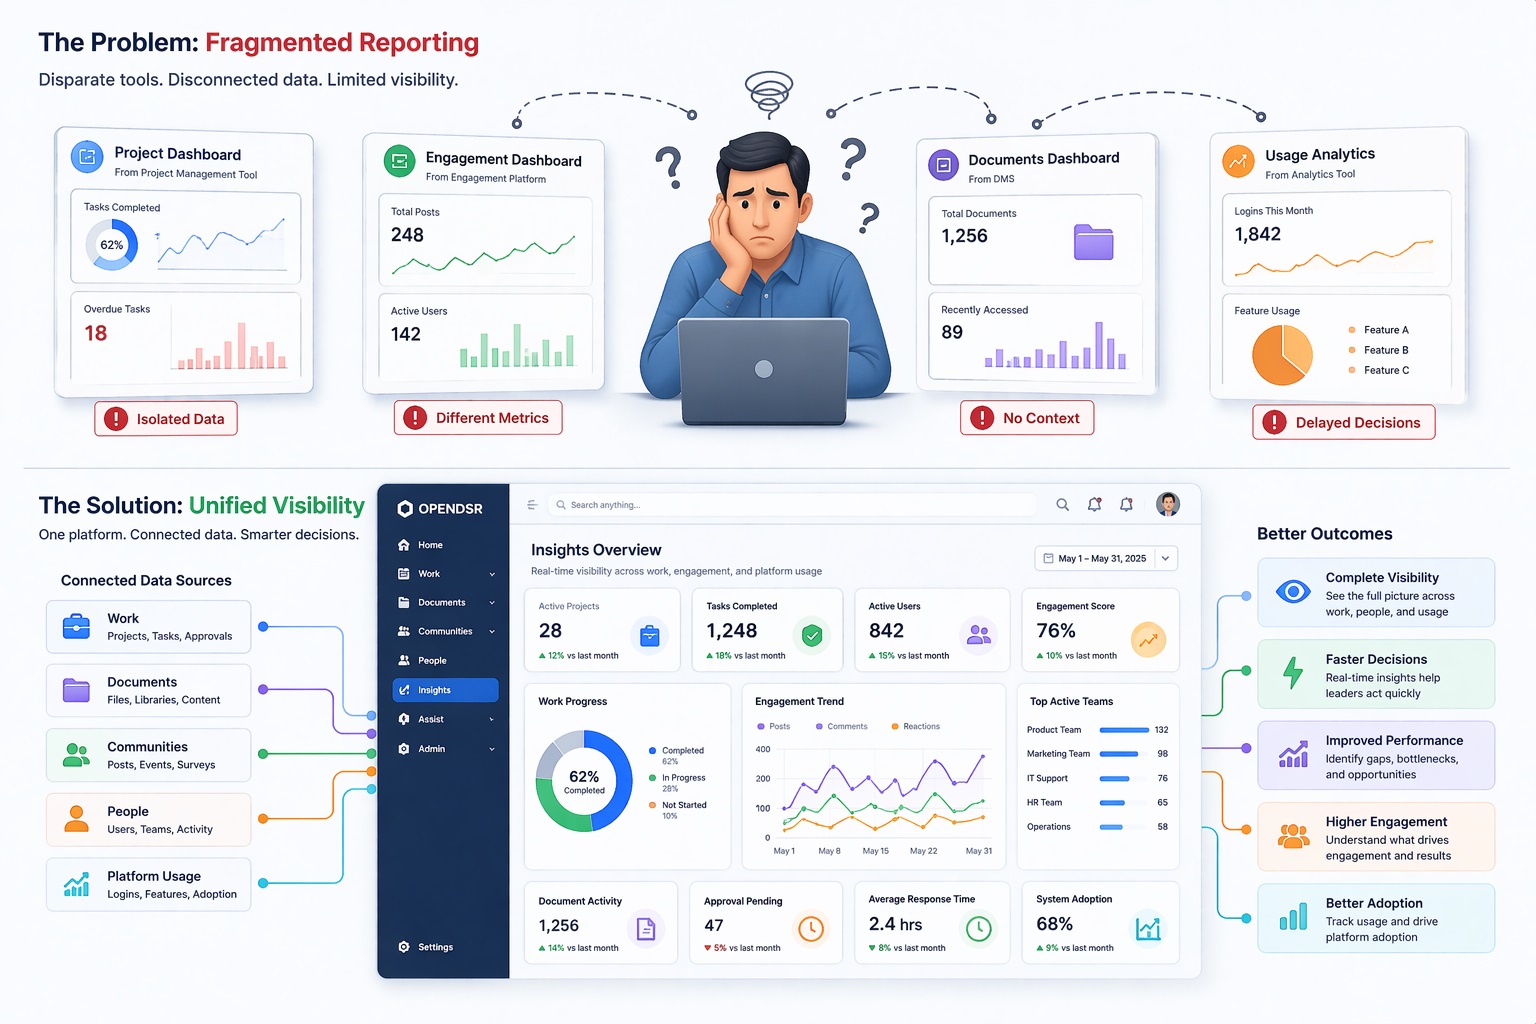
Most organizations rely on disconnected reporting tools — project dashboards in one system, engagement data in another, and usage analytics somewhere else.

This creates fragmented visibility and delayed decision-making.

OPENDSR changes that.

Insights connects data across work, documents, communities, and people into a single, unified analytics layer. Instead of looking at isolated reports, users get a complete picture of how work is progressing, how teams are engaging, and how the platform is being used.

This ensures that decisions are based on real, connected data — not scattered reports.

Let’s Get StartedLet’s Get Started

Everything you need to understand your organization

From work performance to engagement and adoption, Insights provides a complete view across the platform.

Get a high-level view of everything that matters — work progress, team activity, and platform usage. Dashboards bring together data from across OPENDSR into one place, making it easy to monitor performance and identify trends.

  • Cross-module KPIs
  • Visual summaries
  • Real-time updates
  • Custom widgets

Track project progress, task completion, and operational performance across teams. Understand how work is moving, where delays occur, and how efficiently teams are delivering.

  • Task completion rates
  • Project timelines
  • Bottlenecks and delays
  • Team productivity metrics

Measure how teams are engaging through discussions, articles, events, and feedback. Identify active teams, popular content, and engagement trends across the organization.

  • Post engagement
  • Participation trends
  • Feedback activity
  • Event interactions

Understand how your organization is using the platform. Track logins, activity patterns, and feature usage to improve adoption and drive better outcomes.

  • Login trends
  • Active vs inactive users
  • Feature usage
  • Activity heatmaps

Access detailed reports and export data for deeper analysis and compliance needs. Integrate with tools like Power BI for advanced reporting.

  • Structured reports
  • Export options
  • Power BI integration

Identify risks, delays, and opportunities through system-generated signals. Instead of manually analyzing data, OPENDSR highlights what needs attention.

  • Delayed work alerts
  • Low engagement signals
  • Pending approvals
  • Risk indicators
HOW INSIGHTS FLOW

From activity to decision

Every action in OPENDSR generates data. Work activity feeds performance insights. Community activity drives engagement analytics. User behavior shapes adoption metrics. All of this comes together into one unified view — helping leaders move from observation to action.

Not dashboards — a connected intelligence layer

Cross-system visibility

Insights across work, documents, communities, and people

Real-time data

No delayed or disconnected reporting

Actionable insights

Focus on what needs attention

Better decisions

Make decisions based on complete visibility

MICROSOFT FOUNDATION

Built for Power BI and Microsoft ecosystem

Insights integrates with Power BI and Microsoft tools to provide scalable, enterprise-grade analytics. Data remains within your environment while enabling advanced reporting and visualization.

See what’s really happening in your organization

Move beyond disconnected reports. Get complete visibility into work, engagement, and usage — all in one place.

Book a DemoBook a Demo